Dashboard & Shared Patterns
Aligning interaction models across teams so the platform feels like one product
MyGeotab's dashboard and reporting surfaces were the most visited in the platform — and the most inconsistent. Built by different teams over different years, they shared a visual language but not an interaction model. This workstream defined the shared patterns that brought those surfaces into alignment, reduced rework, and let teams ship confidently without waiting on central design approval.
Context & Constraints
Fleet managers spend most of their time in dashboards and reports — reviewing exceptions, checking KPIs, and making decisions about their fleet. These surfaces carried enormous traffic and enormous variation. The same concept (a data table, a filter row, an empty state) was implemented a dozen different ways across a dozen different pages. Users had to re-learn basic interactions as they moved around the platform. Teams duplicating patterns they didn't know existed elsewhere.
Pattern divergence at scale
Without a shared system, teams solved the same UI problems independently — creating subtle inconsistencies that eroded coherence across high-traffic surfaces.
Rework slowing delivery
Teams repeatedly rebuilt similar components from scratch — spending design and engineering time on solved problems instead of product differentiation.
Central approval as a bottleneck
Without shared standards, every significant UI decision required central design review — slowing delivery and creating dependency on a small team.
Full case study detail — including the pattern library built, specific surfaces addressed, and team adoption outcomes — coming soon.
More work at Geotab
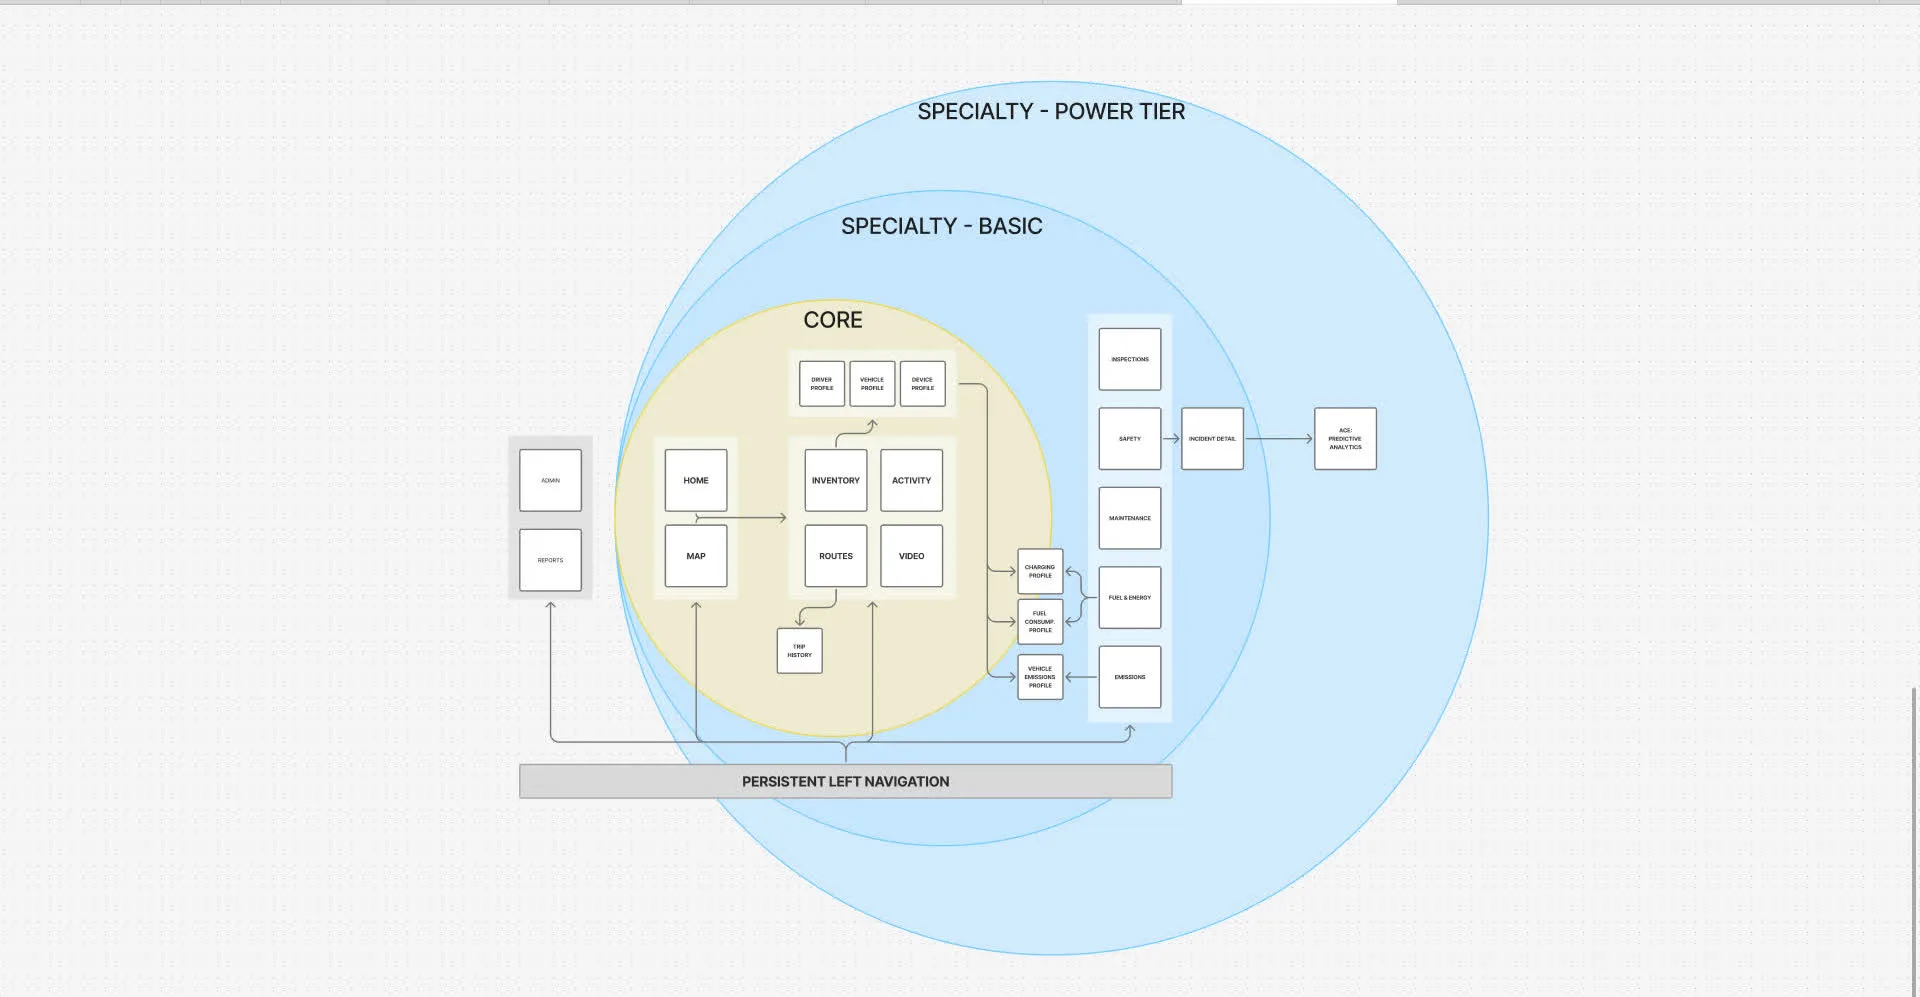
Next Gen MyG
Platform-wide IA redesign — Hub & Spoke navigation that cut new-user churn by 71% across 500K+ operators.
View case study →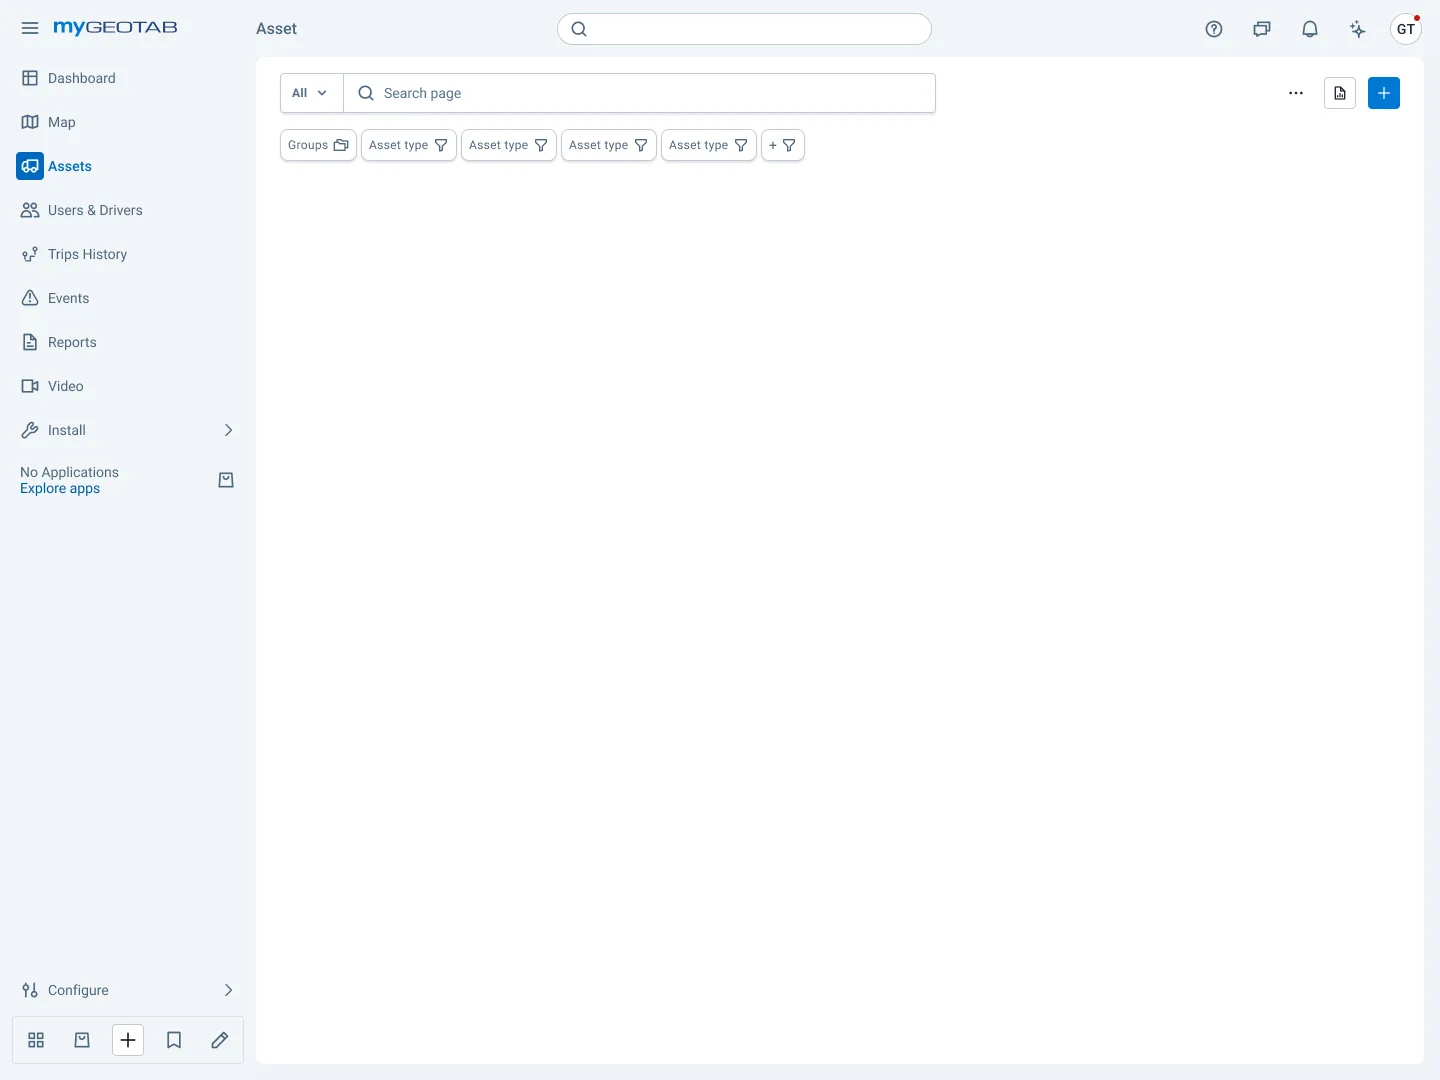
Platform Paper Cuts
Identifying and eliminating high-frequency usability issues — shifting platform culture toward fixing fundamentals safely and continuously.
View case study →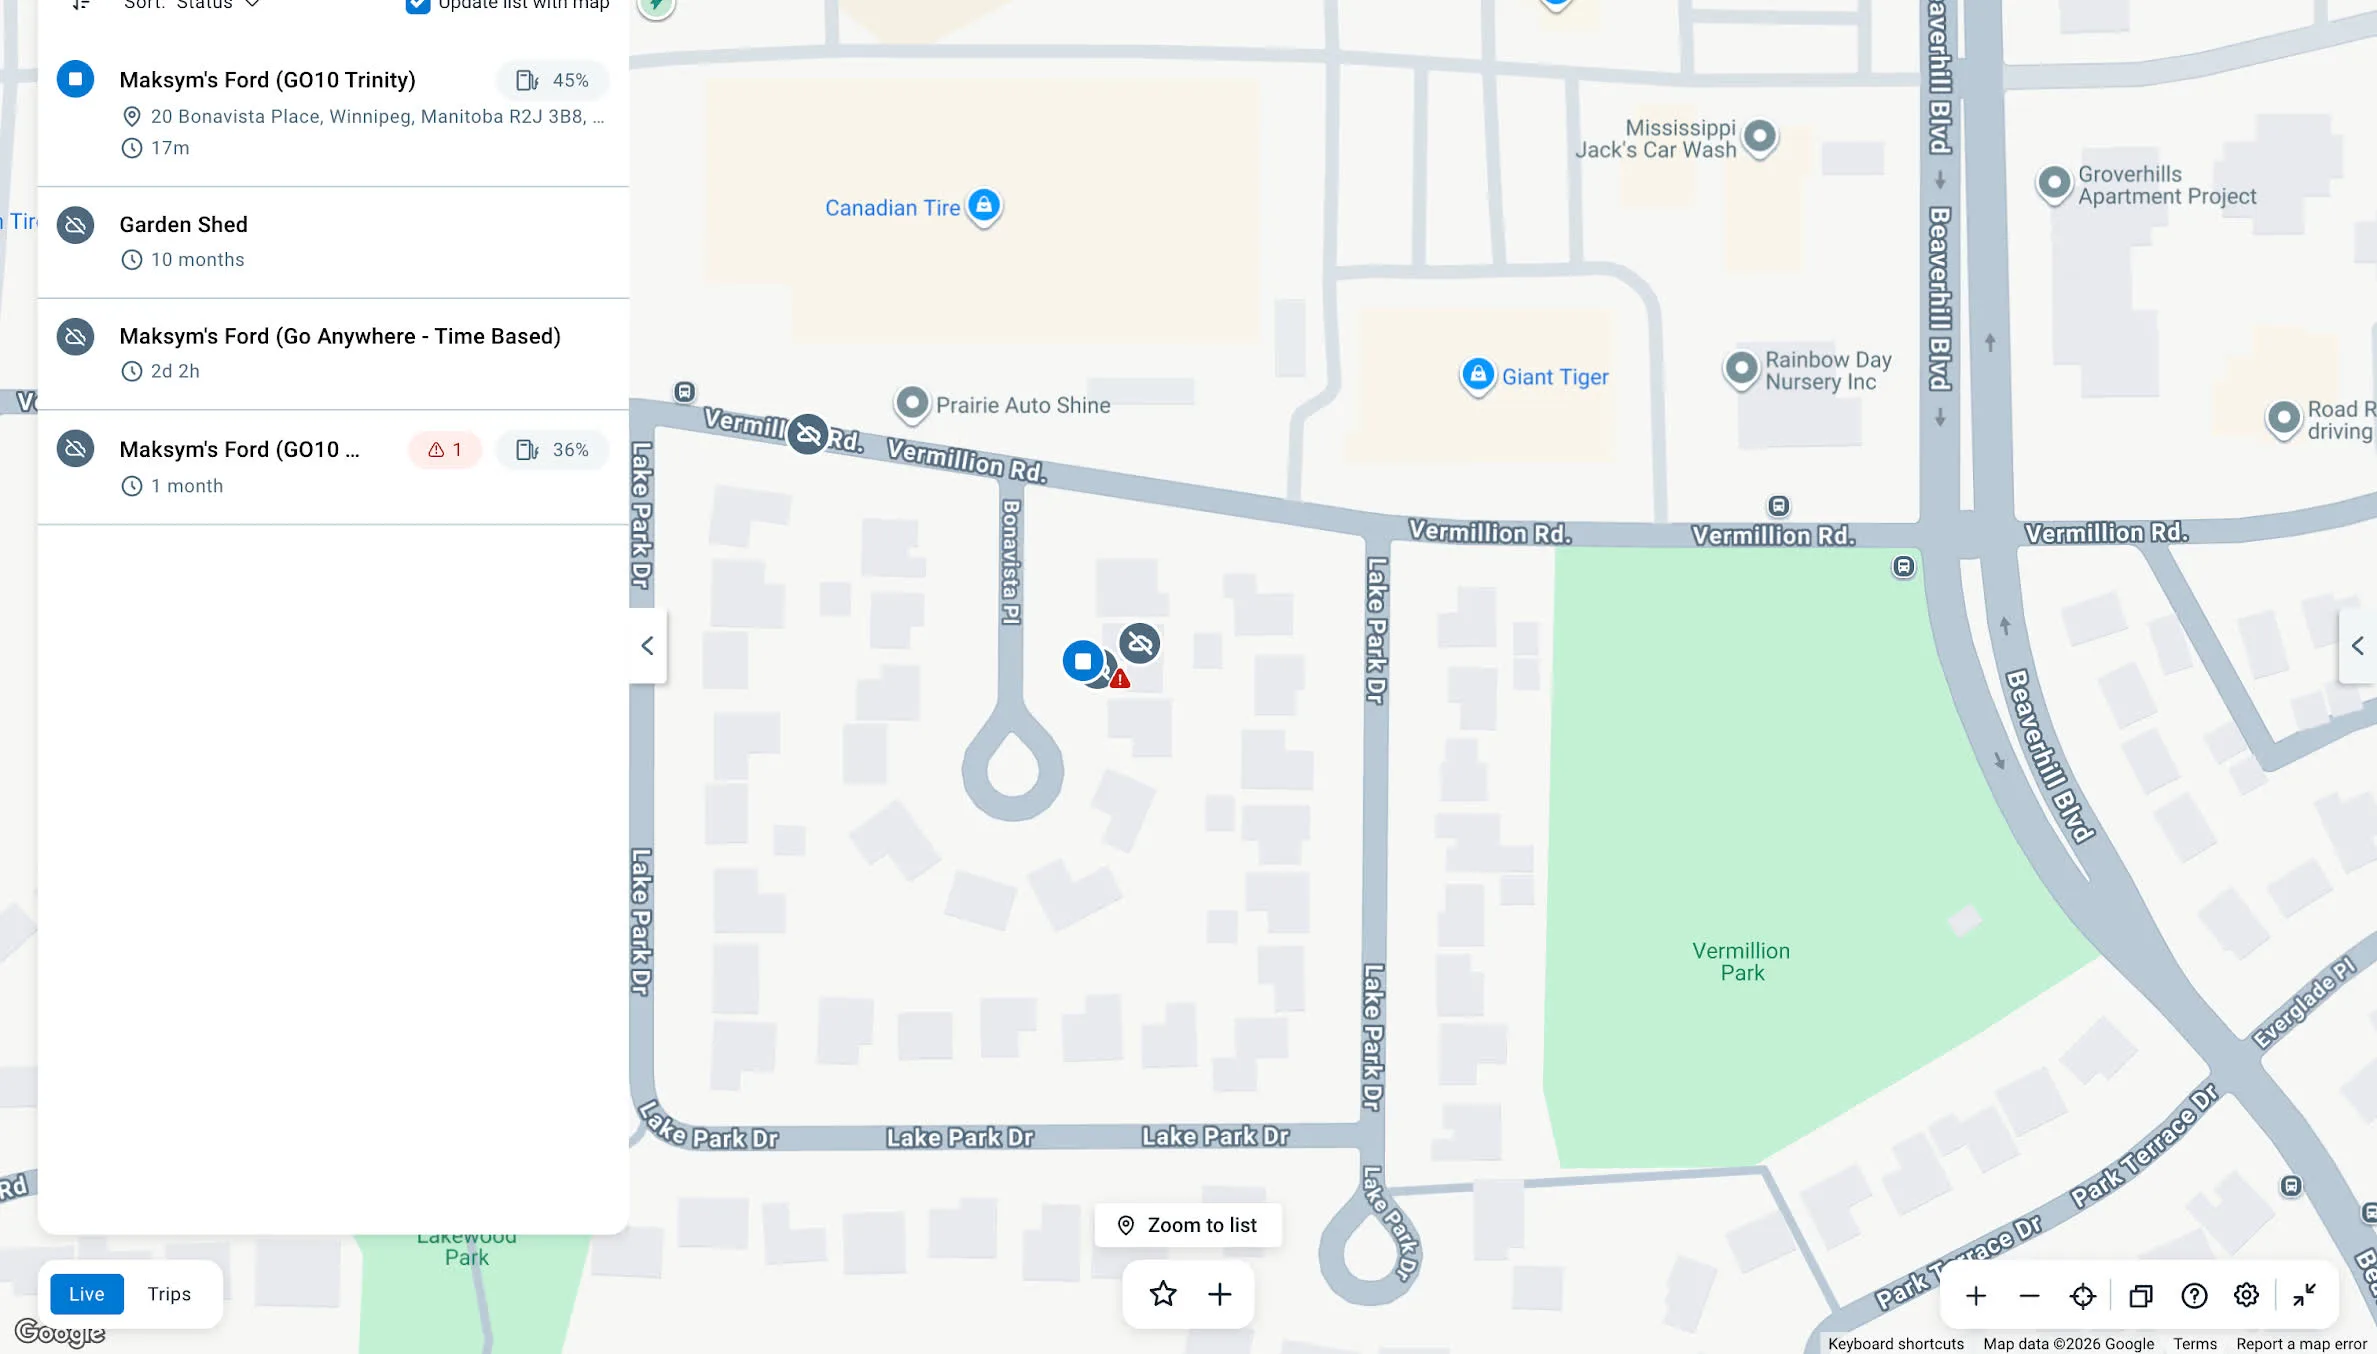
Map / Trips / Zones
Unifying live tracking and historical trips into one coherent surface — redesigning the most-used page in MyGeotab.
View case study →